Motivation for Visualizing Activations
In CNNs, filters slide across input feature maps and produce varying response strengths at different positions. Higher dot products at certain positions indicate what the filter is designed to detect. We want to identify these high-response positions to understand what each filter is looking for.
The word "activation" here refers to filter response strength, and has nothing to do with activation function
Maximally Activating Patches
Strategy
We record the largest activation values then display the actual images patches (the receptive field the neuron is actually seeing) that caused these maximal responses
Steps
- Choose a specific filter
- Record largest activation values
- Find maximally activating patches, i.e., the patches with highest activations
- Display actual image patches, i.e., the receptive field that causes these maximal responses
Saliency
Saliency via Occlusion
We mask part of the image before feeding it into CNN, then we check how much does this effect to the prediction probabilities
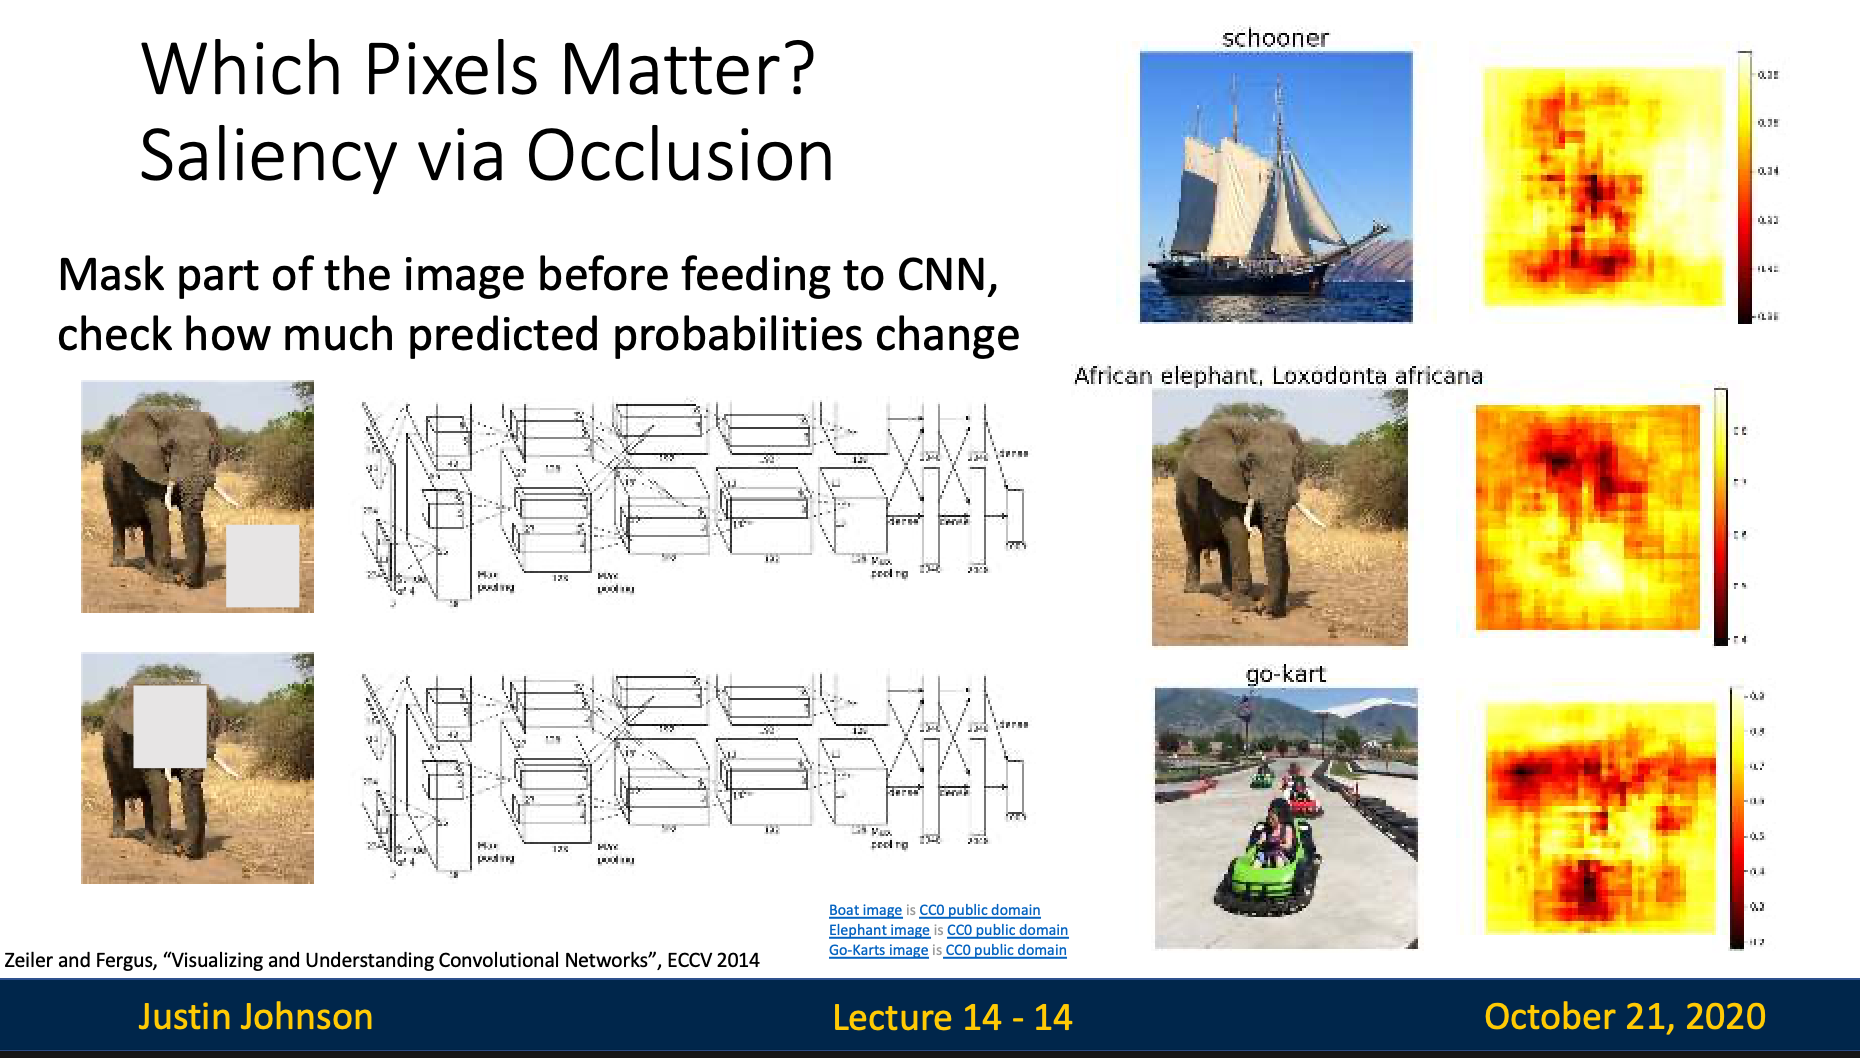
Disadvantage: Inefficient
For every image, we need to slide the mask through every possible positions, and in every time, we need to pass the image through CNN
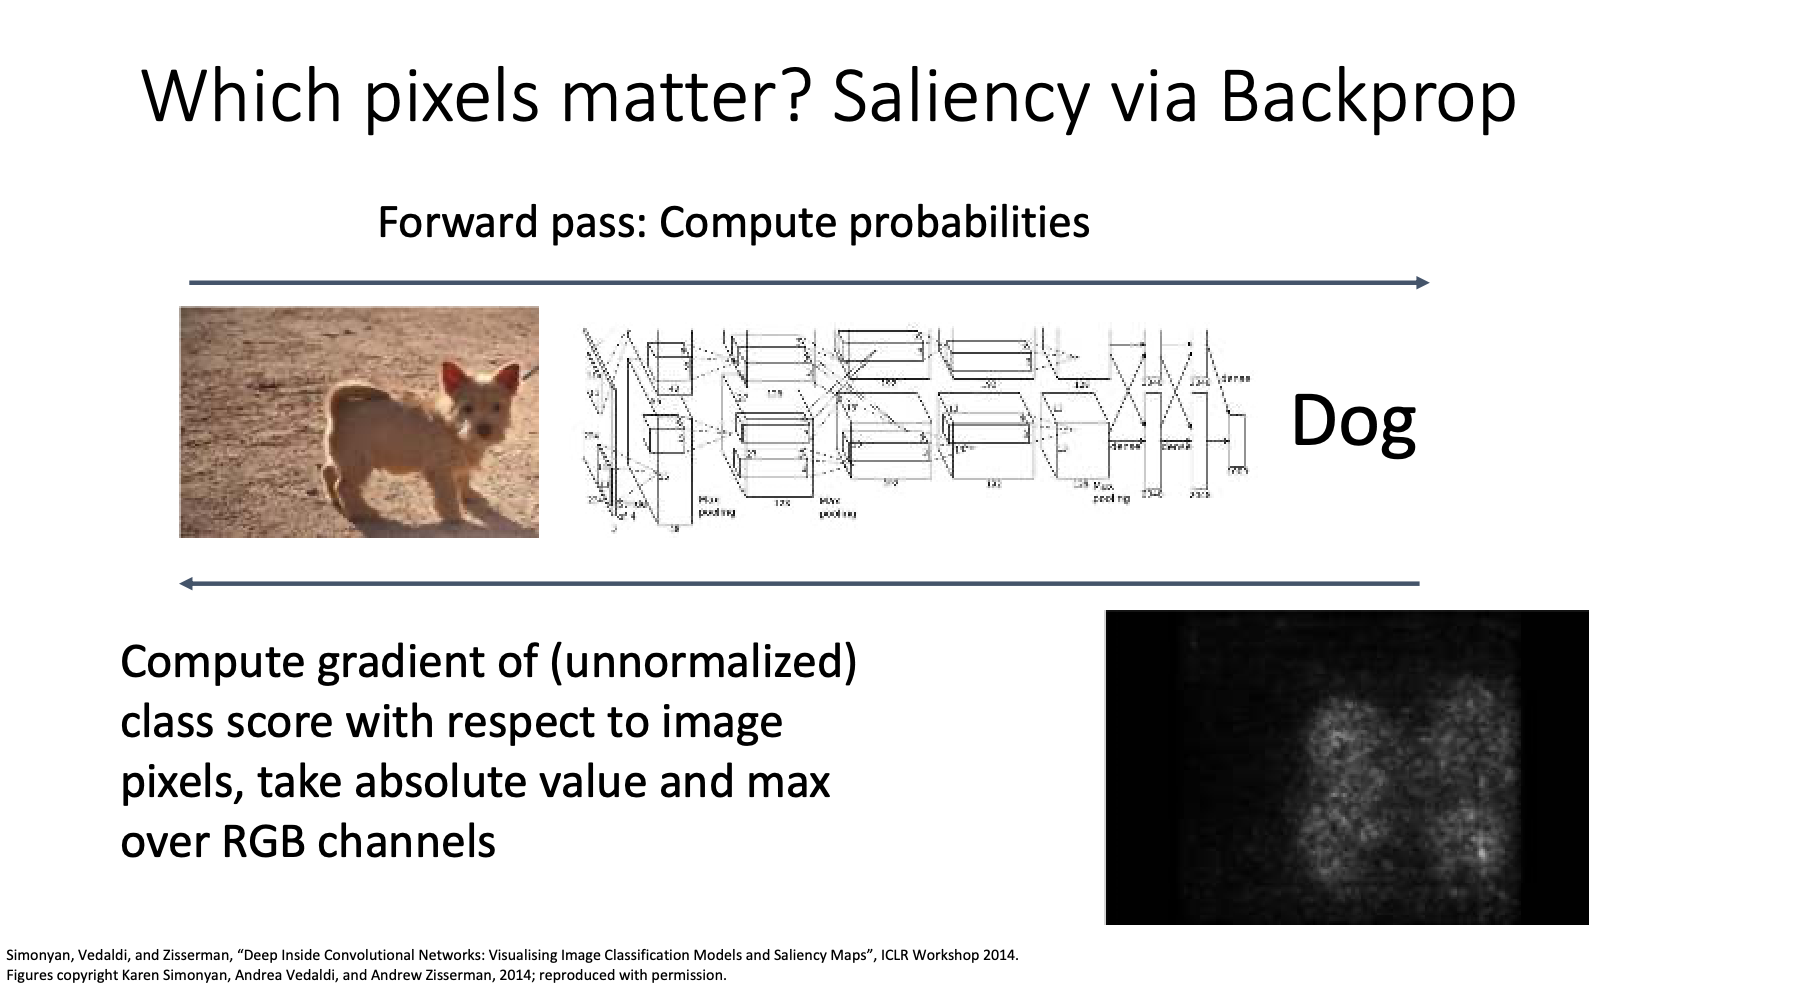
Saliency via Backpropagation
Compute gradient of class scores with respect to actual image pixels, then we can know how strong will each pixel in the image affect the class score
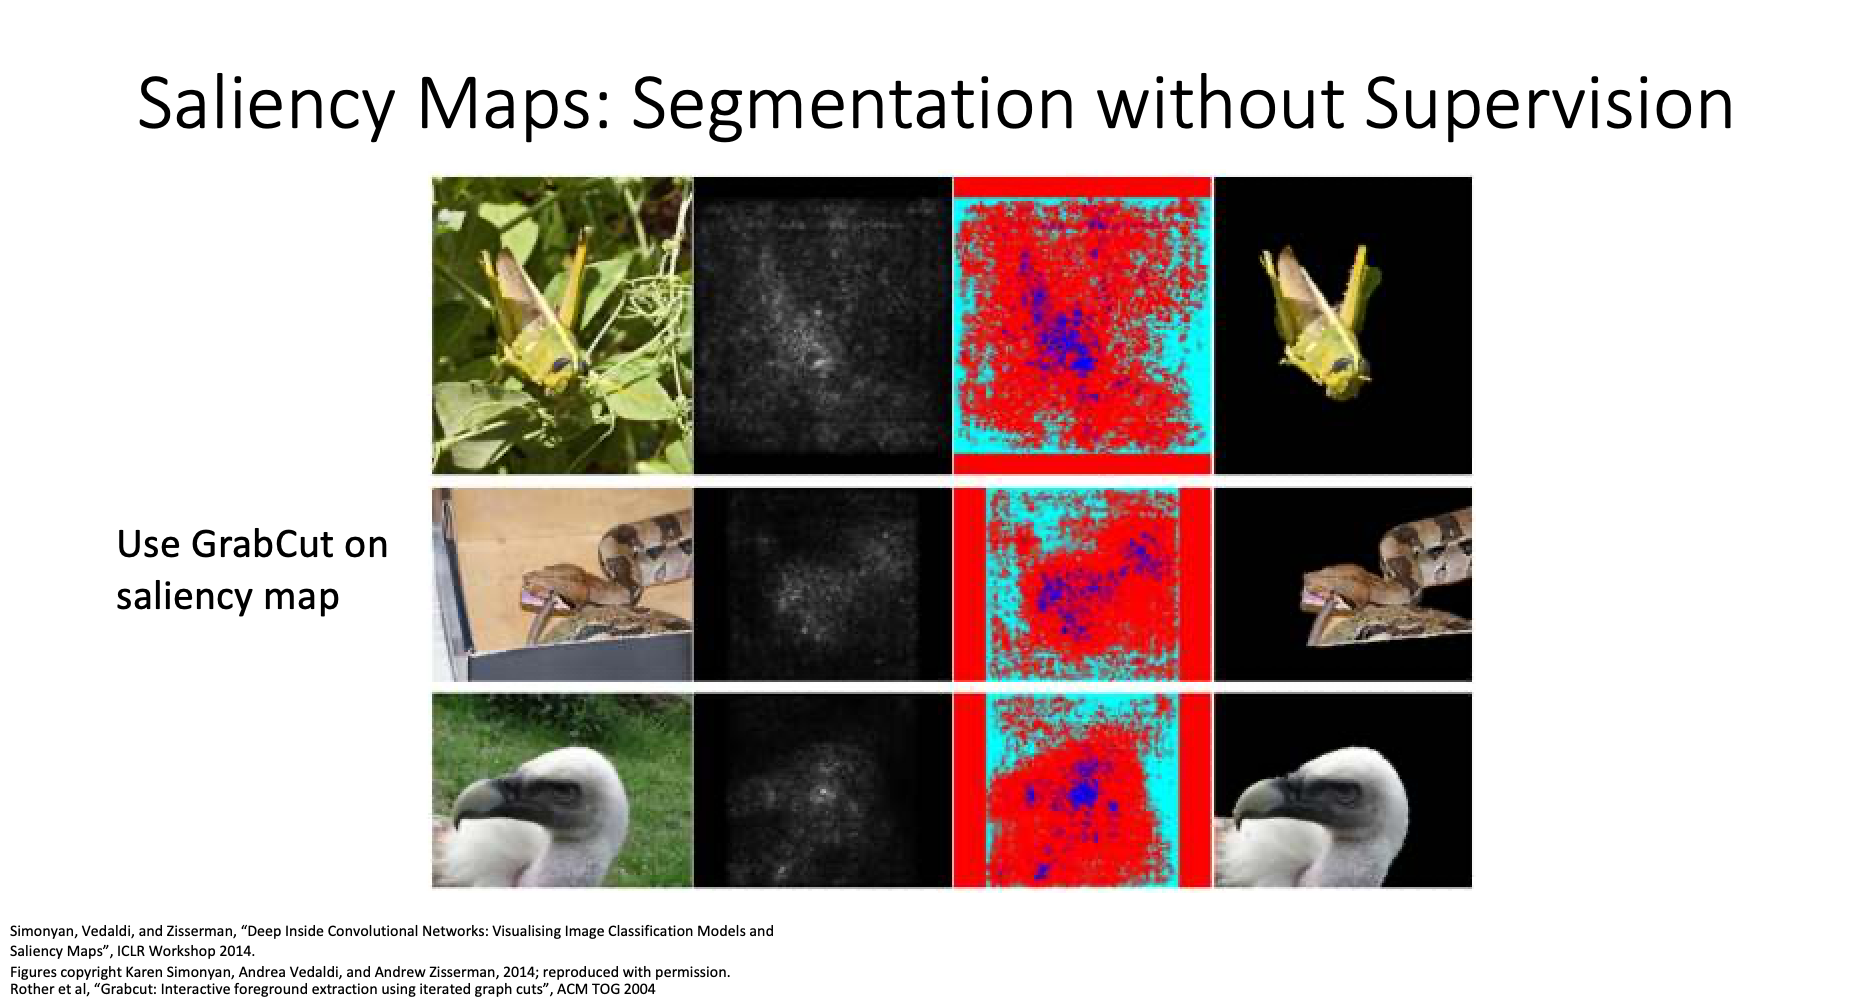
Segmentation without Supervision
The gradients computed previously tell us how important is each pixel to the whole picture, we can thus apply some algorithms utilizing the “saliency map” to eliminate the unnecessary background in the image