Mean Average Precision (mAP)
mAP gives us a way to evaluate how good the object detector is working
Steps
Step 1: Run object detector on all test images (with NMS)
Run object detector on all test images (with NMS)
Step 2: Compute Average Precision (AP) for each category
Matching Prediction to Ground Truth
- Classify detections based on their categories
- For every category, sort the detections from high to low based on the confidence score
- Start from the first detection
- Compute IoU between the detection and ground truth
- If the highest IoU is larger than certain threshold (e.g. 0.5), then we mark the detection as “true positive” and eliminate the corresponding ground truth; Otherwise, we mark the detection as “false positive”
- Compute average precision
What is Precision and Recall?
Precision: “Of all the things we predicted as dogs, how much of them are actually a dog?”
Recall: “Of all the dogs in the picture, how many of them were predicted?”
Precision and Recall often trade off against each other
When we make more predictions, there will be better recall and worse precision, and vice versa.
Precision - Recall Curve
Every time when we process a detection, we’ll plot a point on the PR curve. The -axis of PR curve is “recall”, while the -axis is “precision”, they both have value between 0 and 1
The value (recall) tells us what percentage of objects is found in the image The value (precision) tells us what percentage of detections is correct
Connecting all the points on the graph gives us the precision - recall curve
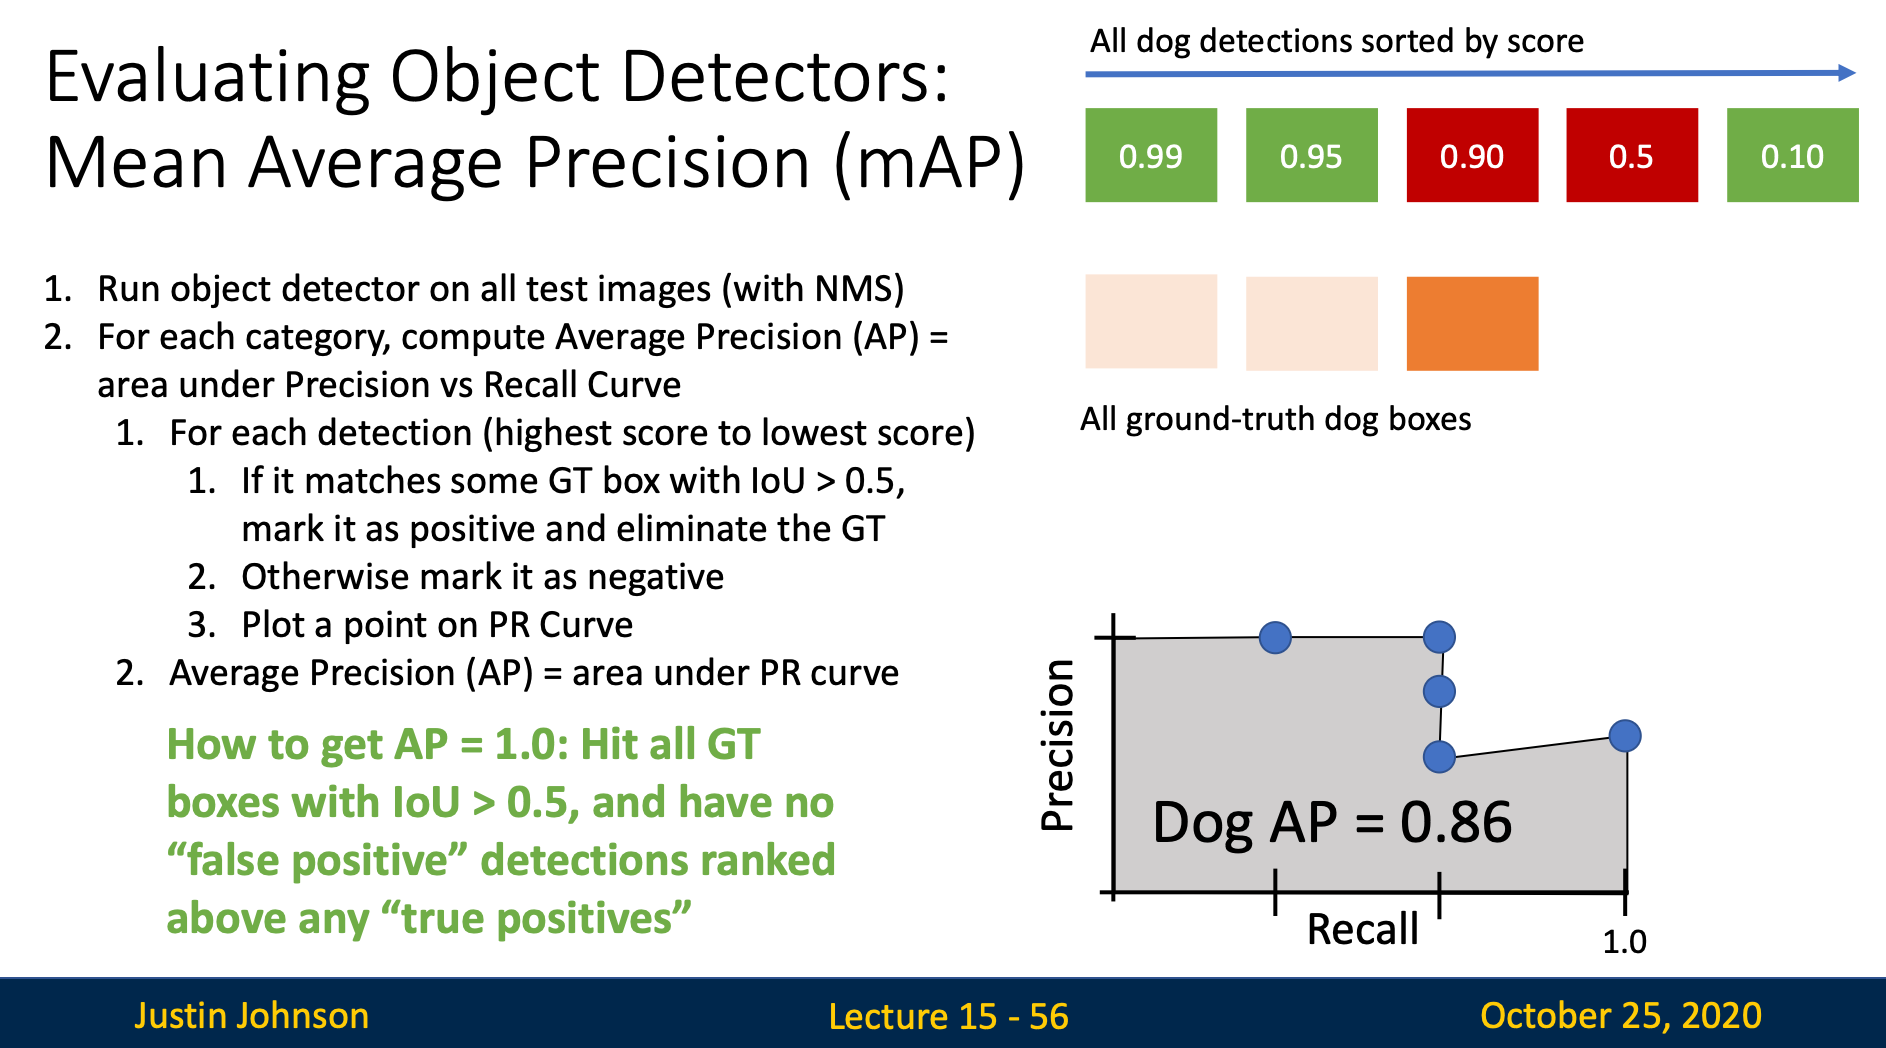
Computing Average Precision (AP)
The area under the PR curve is the AP for that category
Step 3: Compute Mean Average Precision (mAP)
mAP = average of AP for each category